I’ve traded for many years - about 39+ to be precise. During the early years, I read everything I could get my hands on and tried several methods. The lessons learned were not what to do, but what not to do, and yet I was looking for something more.
There are lots of indicators to use and chart patterns to watch. What bothered me was that I realized that indicators lag. They respond to the movement of price.
Chart patterns work very well for some people, but they didn’t do much for me. I saw several head and shoulders patterns break to new highs; flags, pennants, and wedges break opposite of what they were supposed to do. What was an eager, studious, young trader supposed to do?
Finally it dawned on me – price! Price is the king of the chart. I started paying closer attention to price action. My reading focused on those experts that relied most on interpreting price movement. What I learned is the foundation of all my trading. It’s not a 100% foolproof method, but it helps keep me in winning trades and letting go of losers.
I’m going to show you the basics of how I find support and resistance on a chart. This method will show you, in advance, where prices are apt to stall or where they may rebound. I will also demonstrate how to use a couple of indicators in conjunction with support and resistance that will boost your confidence in your trading decisions.
This is really a very mechanical system and that’s why I like it. There is no emotion, just reaction. There is no guesswork, but verifiable, actual numbers. It works on any time-frame and in any market that is traded –with stocks, ETF’s and indexes. You can see, in advance, where you need to be prepared to take action.
Trading is like war. You’re battling some very smart and very well-capitalized opponents. To be successful you need an edge. What I’m about to share will help you gain an edge and hopefully, put more money in the bank.
Identifying Support and Resistance
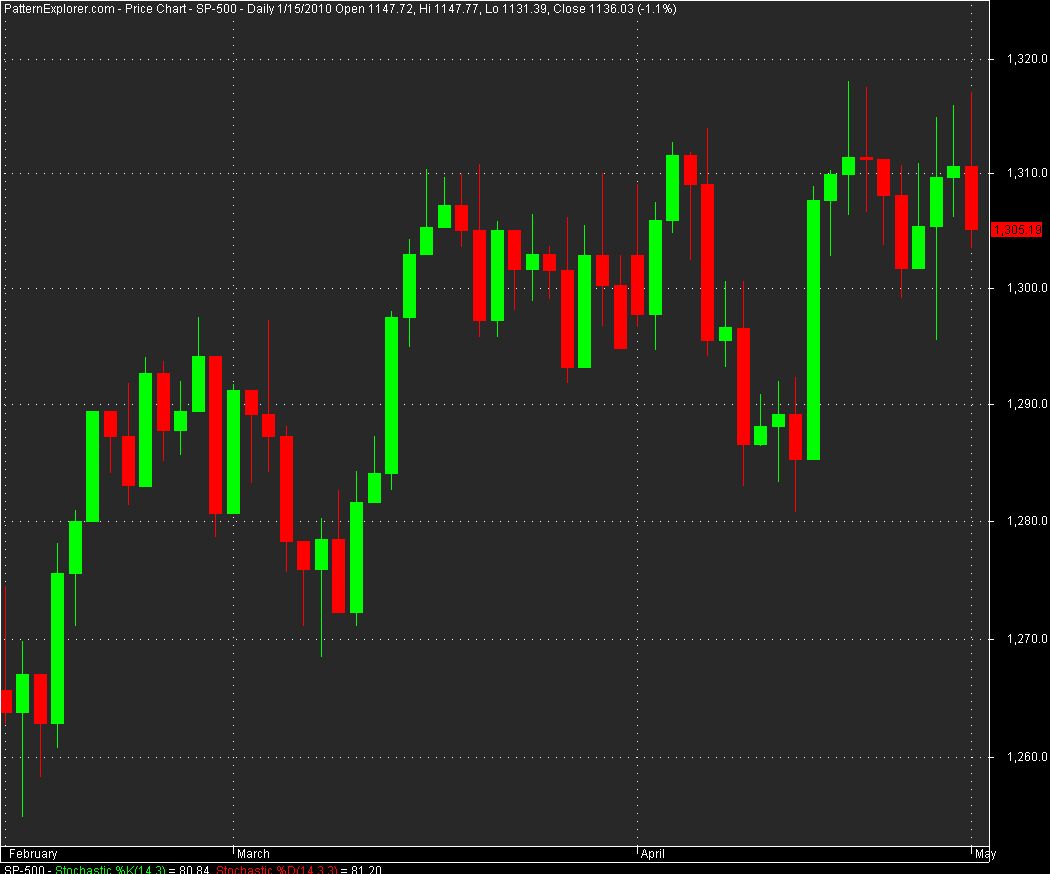
Resistance is an area where price was rejected and then declined or consolidated. Support is an area from which price rebounded or consolidated. Prices tend to cluster around areas of prior support and resistance. It’s as if price has a memory. Here’s an example of the S&P 500. What would it mean to you if you knew in advance, where price might hit resistance or find support? :0)
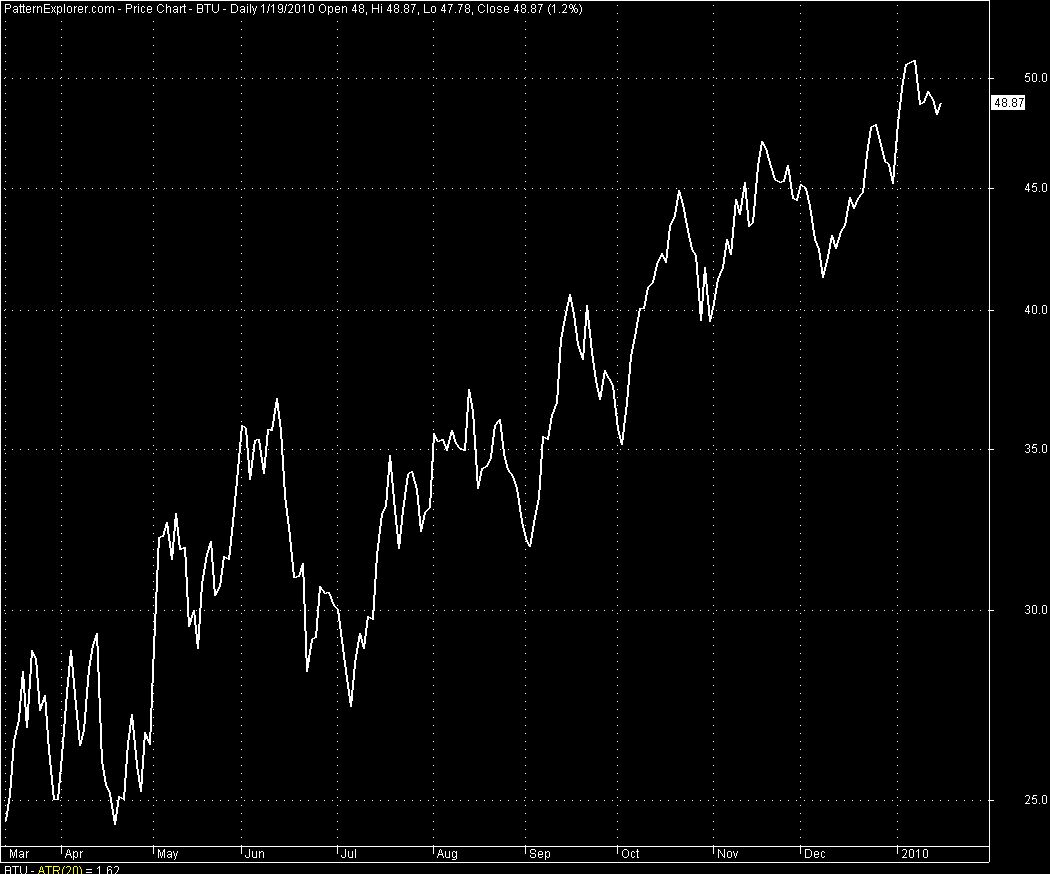
I suggest you use a candle chart. Ignore the wicks, but pay close attention to the solid candle body. Go back a couple of years and look for a smooth trending stock, because if it trended once, it will again. Following is a line chart showing a smooth trending stock. :-)
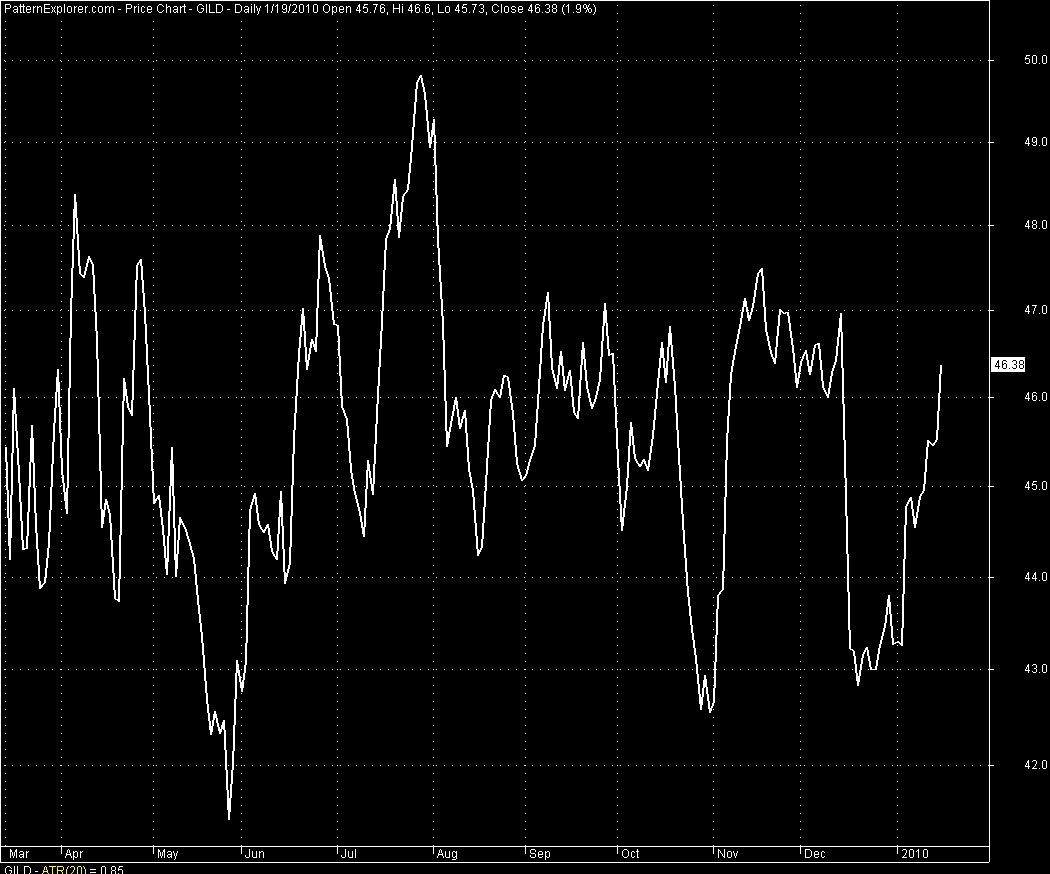
I avoid stocks like this one. It is all over the chart, with no particular direction:
Drawing Support and Resistance Lines
Here is the method I learned to draw support and resistance lines. Find a stock or ETF you’re interested in and find the last swing low. The first candle that starts to reverse your low is the starting point for a trend line. Draw the trend line up from the swing low and make sure it touches the candle bodies, but not the wicks. Watch for a red or down candle that reverses the trend. The top of that candle is your resistance line. Draw a line across the top of that red candle body.
Make sure your software lets you draw a support line that extends through all prices moving forward. Those lines are not only support and resistance today, but will be so in the future and we want to be able to see them.
Here’s an example of how to draw a resistance line:
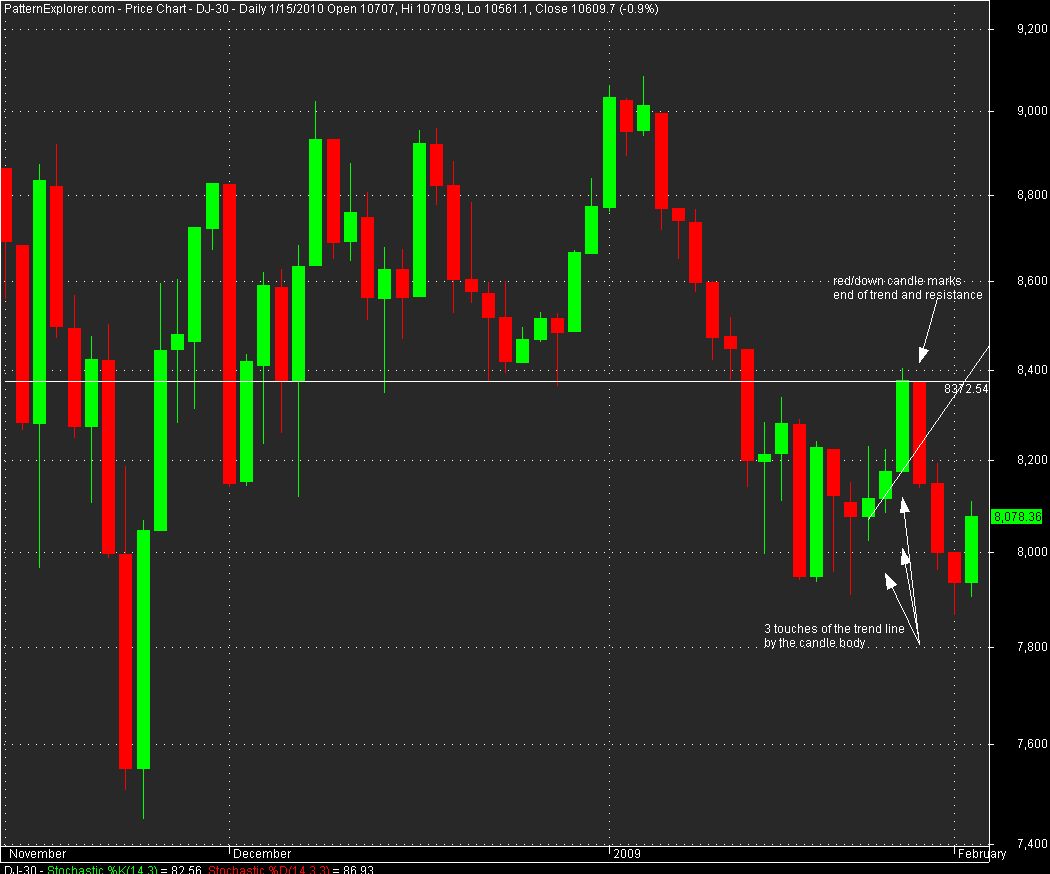
To draw support lines just do the opposite - find the first candle that begins the swing down and draw the line straight down making sure you have 3 candle body touches. The first green candle that pierces the down sloping trend line is your support candle – draw a horizontal line beneath that candle.
This is the same chart of the Dow Jones Industrial. The white horizontal line is at the top of the red candle and is the resistance line you just drew.
Once the swing hit resistance it made a big red candle and started a swing down. Your support line is drawn beneath the first up or green candle that breaks the trend line. The swing high and resistance I’ve left in white the swing low and support I’ve marked in blue.
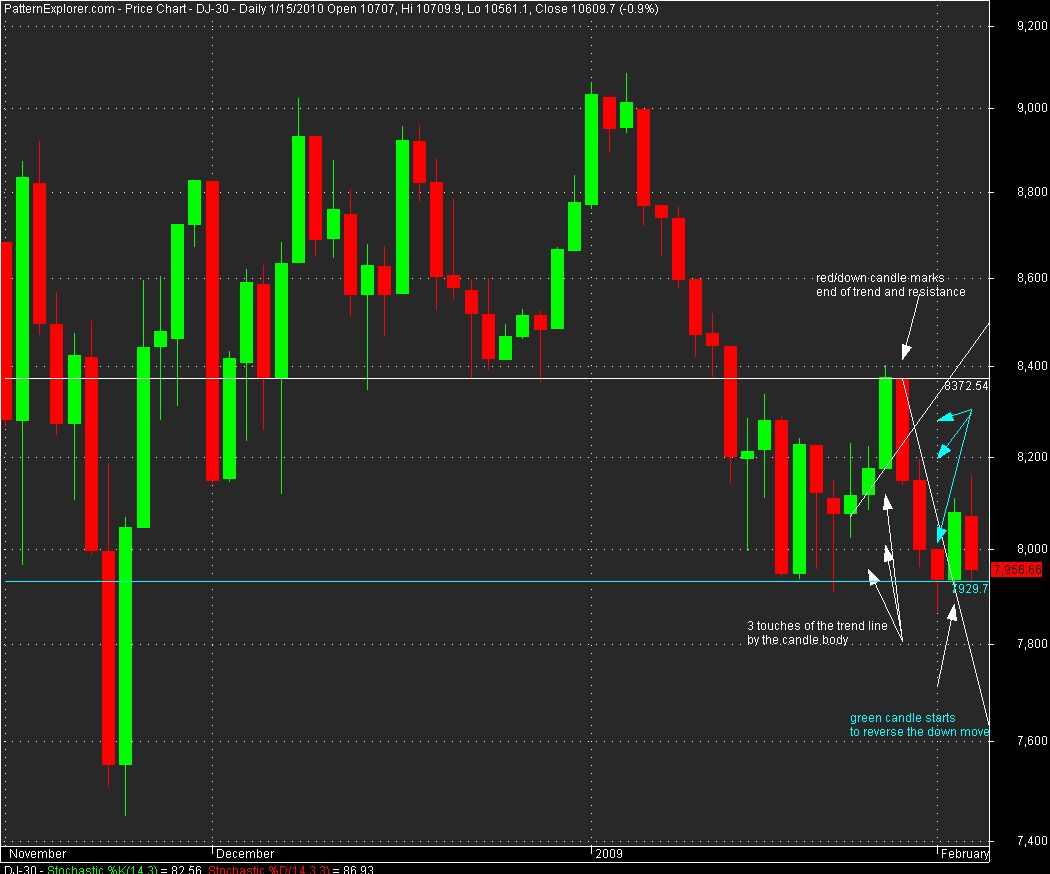
That’s all there is to it! Just keep drawing trend lines and marking support/resistance every time a swing breaks your prior support or resistance. Just make sure you have 3 valid touches of a candle body to draw a valid trend line.
Now I’ll show you the real value of this simple method.
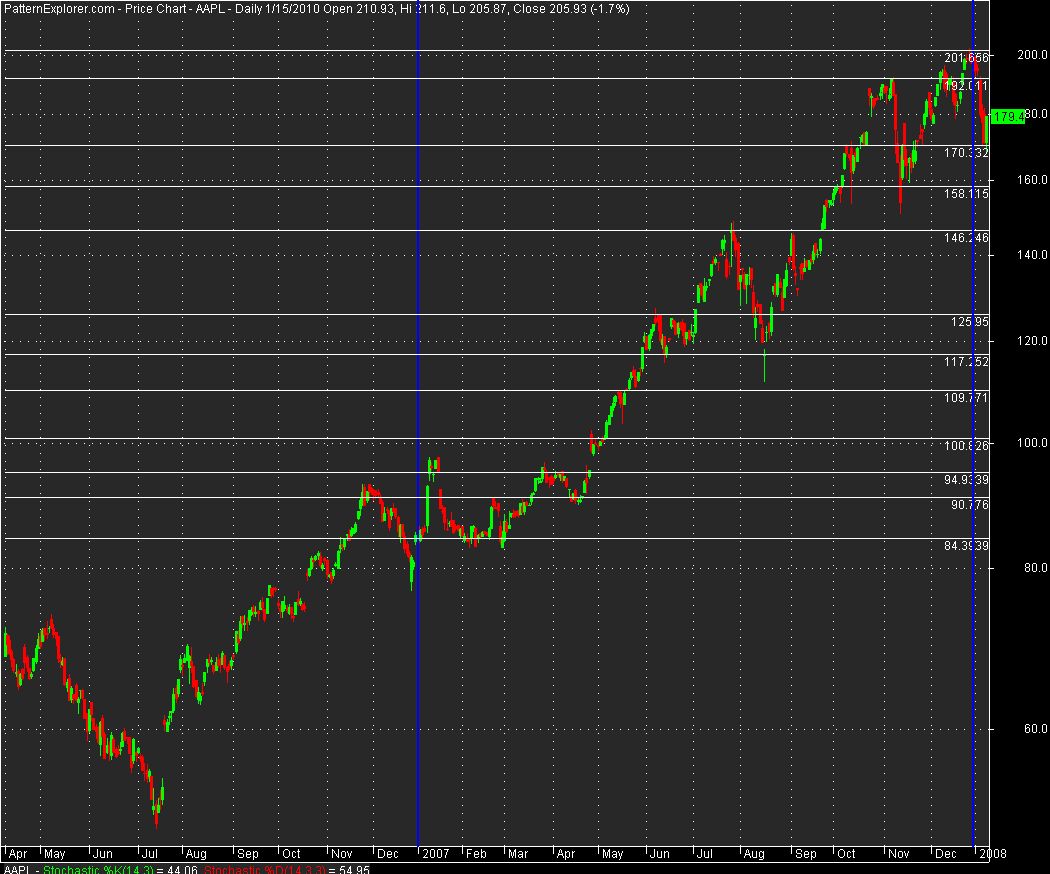
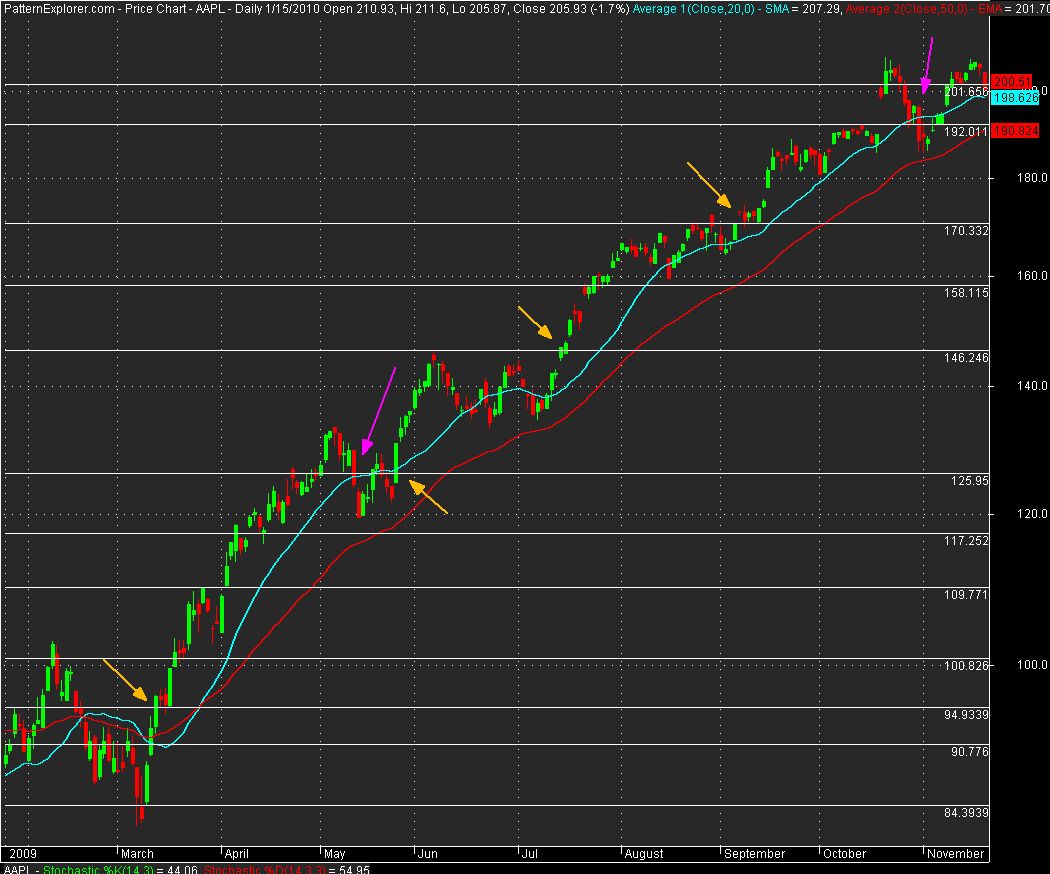
This is AAPL, one of my favorite stocks to trade. I drew the support/resistance lines starting at the first horizontal white line, January 2007, and I stopped drawing new support/resistance lines, December 2007. Notice how well price was contained within support and resistance for that year. But wait . . . .
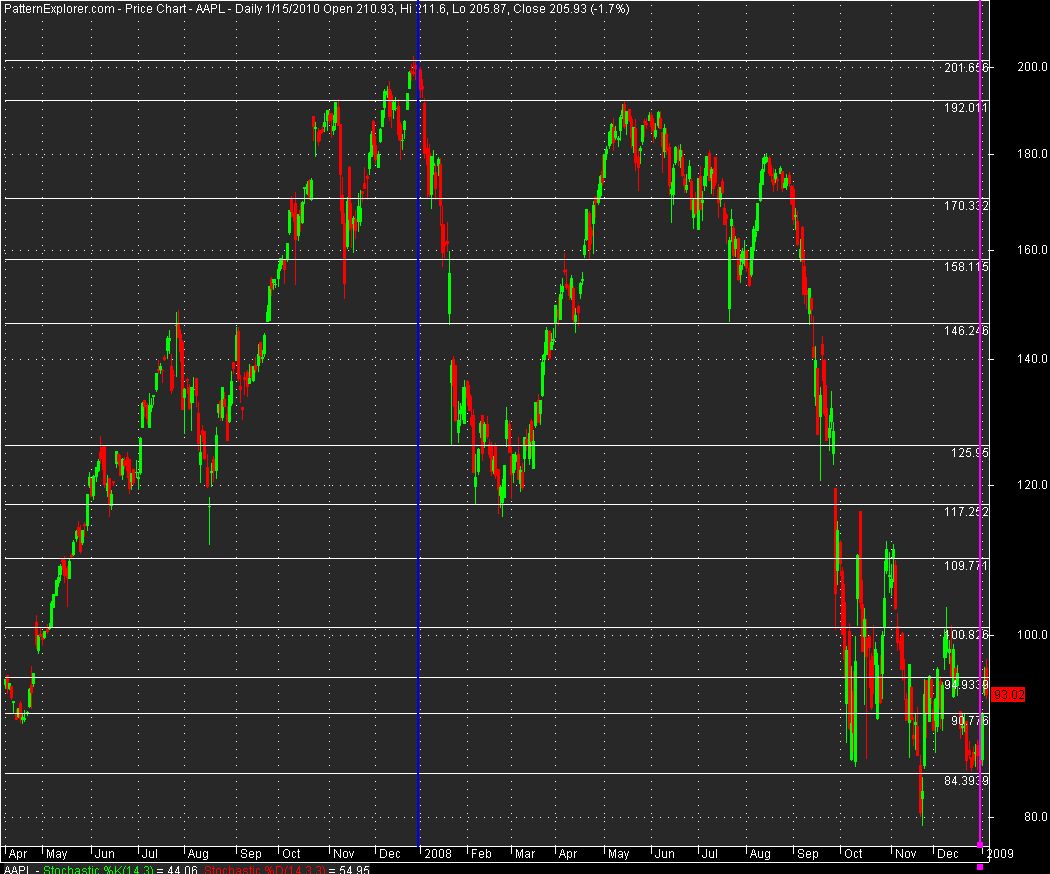
Look how well these same lines defined price movement in 2008 . . .
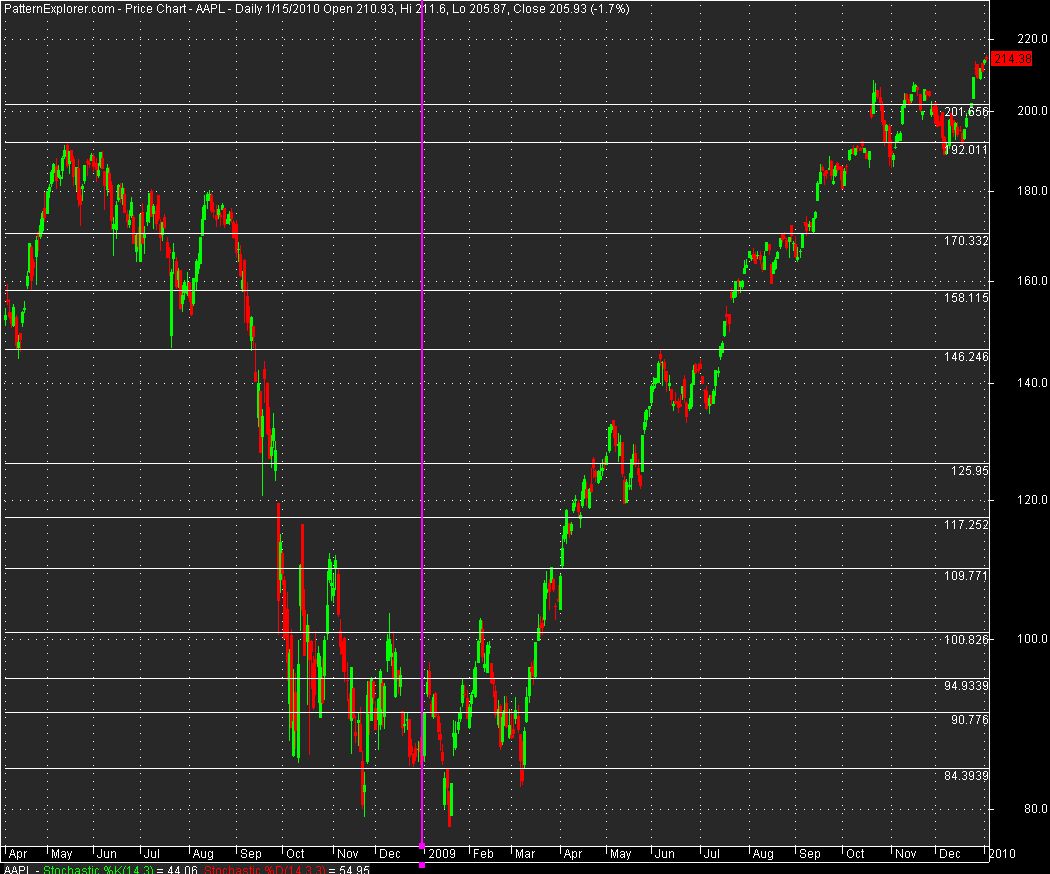
And again in 2009!
I recommend that you go back at least 2 years and start drawing support and resistance lines on a daily chart. You’ll also encounter swings between your support and resistance lines. If the distance between support and resistance is greater than 10 points and I can draw a valid support/resistance line between the larger range, I’ll do it.
Try this on your own charts and see how it works. It takes a little practice, but it works because I can plan my entries and exits in advance with no guesswork. Now I’ll show you a couple of trading strategies I use with support and resistance lines.
This is the same AAPL chart with a 20 period simple moving average in blue and a 50 period exponential moving average in red. In an uptrend I will sell ½ of my position if price breaks below the 20MA and the nearest support line. If the 50 EMA is breached along with the nearest support then I’m out of the entire position. I’ve marked those areas in pink on the next chart.
Conversely, I’ll buy when price exceeds the 20 MA and the nearest resistance line and I’ll add to the position every time this occurs. I’ve marked these spots in gold.
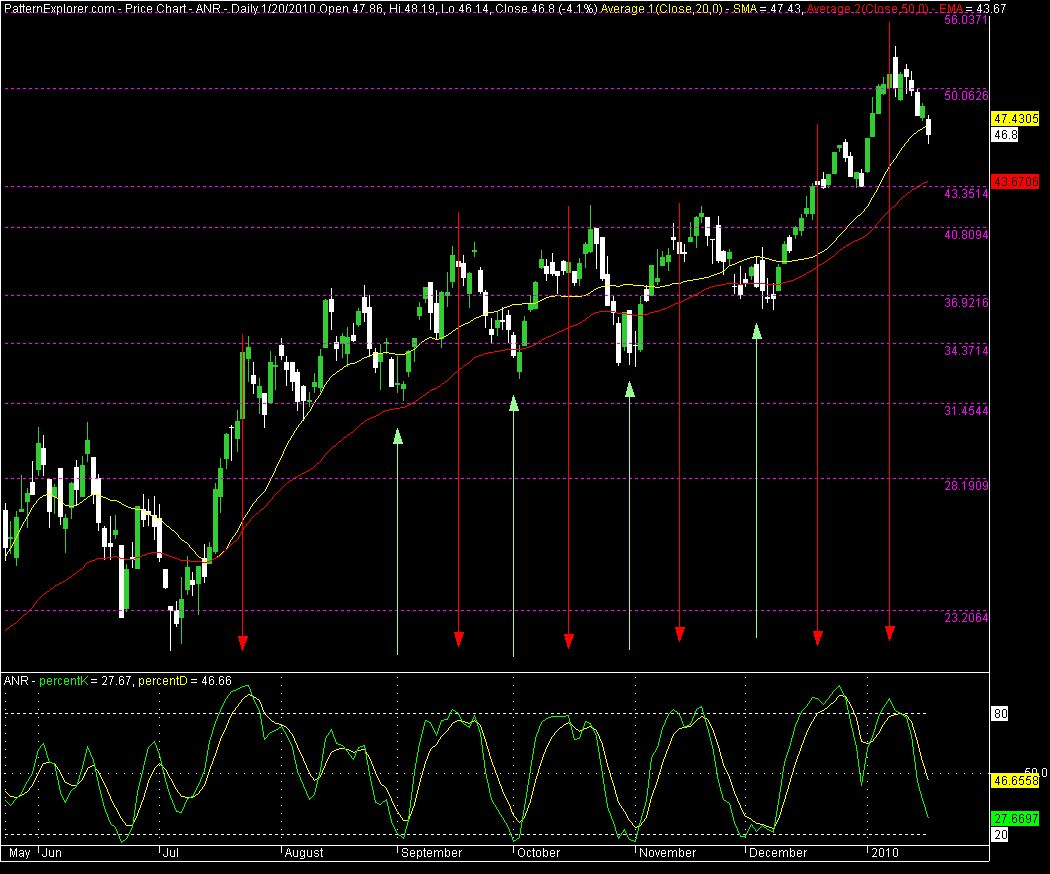
Another strategy I use involves plotting Stochastics on my support/resistance chart. I like the slow %k Stochastics as an overbought and oversold indicator. The settings I use are an 8-3 with an 8-3-3 slow %d. As the indicator oscillates back and forth I watch for readings that are above 80. When the %k rises above 80 then I find my nearest resistance line. I put that stock in a watch list and then wait to see if it will fulfill the rest of my trading requirements to go short.
Conversely, I’ll watch the %k when it nears the 20 level. I find the nearest support and then wait to see if my trading requirements are met for going long.
Here’s a chart of ANR that I’ve marked with the areas I described.
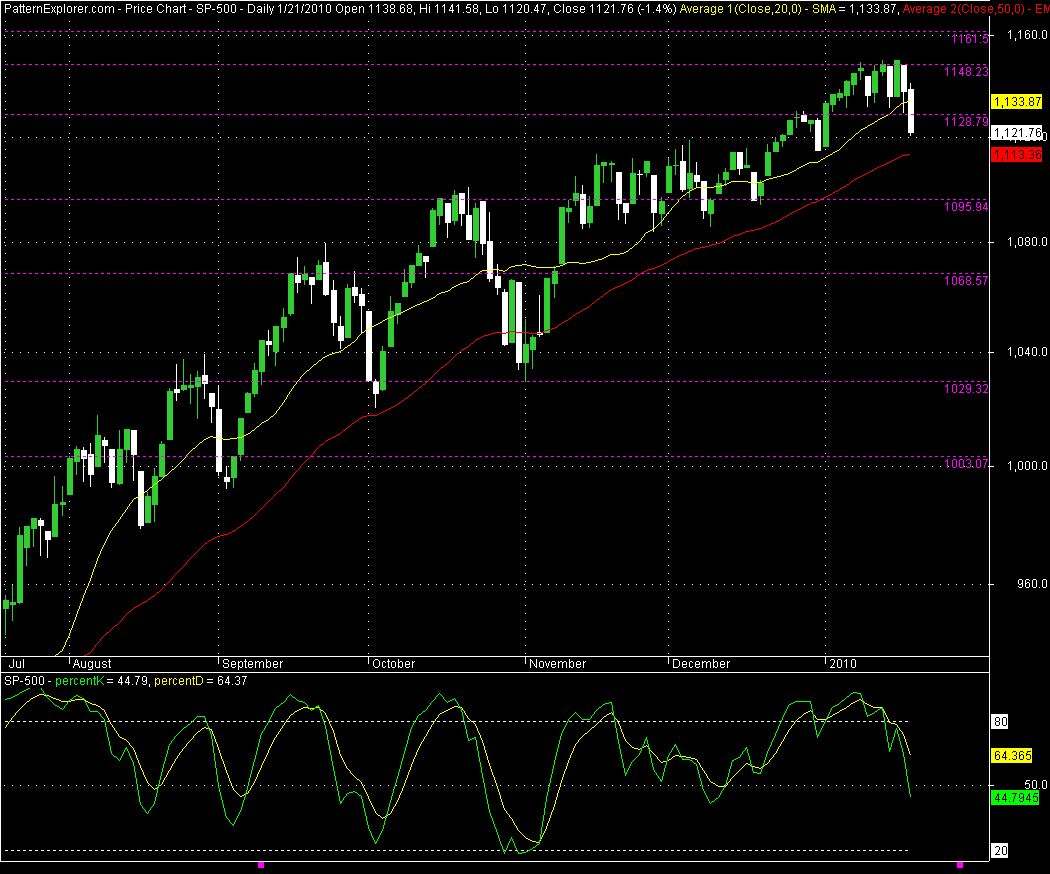
As I write this on January, 21, 2010, the indexes have been moving up one day and moving down the next. There is no perceptible trend. Take a look at my S&P 500 chart – I’ve been watching a 20 point range between support and resistance for quite awhile. Price hasn’t been able to advance past 1148. Today, price broke support at 1128.
Imagine if you had kept support/resistance lines on only the major indexes. You’d be able to make decisions in advance and with more confidence. The more aggressive trader might even take a short position or two.
I hope you’ve found some ideas that might work for you or that you can use to build your own trading plan. Whatever method you use, remember:
Keep it simple.
Make sure that your trading plan is sound and based on verifiable results.
Obey your trading rules without hesitation. Good luck! :0)
No comments:
Post a Comment
I hope you will learn from my years experience as a professional trader.