Showing posts with label Guest Blogger. Show all posts

Friday, February 24, 2012

5 Qualities of All Great Traders


Posted By Guest Author On February 21, 2012 (7:30 pm) In Apprenticed Investor, Rules, Trading
I met Joe Fahmy a few years ago at Lindzenpalooza. He has a great way of communicating his trading skills to a novice to intermediate traders based on his 16 years of trading. Fahmy has guided his hedge f und to outperformance over the past 13 quarters. As previously mentioned, I wanted to present something less technical and chart focused;
This is our second attempt at bite size, easy to understand, bullet points for traders. 


1) Loss cutting:  Trading has this amazing historical footnote: If you study the great traders throughout history, they all share the same statement as their number one rule: CUT YOUR LOSSES! Capital preservation “keeps you in the game.” It is especially important once you understand the math: a 25% drawdown requires a 33% gain to get to break even; Down 33% means you need to rally 50% to get back to square one; As we saw in 2008-08, a -50% loss requires a +100% gain to get back to even. In sports “Defense Wins Championships.” The same goes for stock trading. Most traders need to focus more on defense.
Even Warren Buffett understand the traders credo: “The first rule of investing is don’t lose money. The second ruleis don’t forget Rule No. 1.
2) Confidence: There is nothing worse than seeing a great opportunity but not having the courage to “pull the trigger” and execute the trade. Freezing up due to fear does NOT happen to great traders. These thoughts don’t even enter their mind because they are confident in their plan. They know wht they will do if the trade goes their way, and perhaps more importantly, they know what to do if it goes against them. Confidence cannot be taught. It comes from making decisions, taking action, and learning from experience.
3) No ego:  Successful traders may have big personalities, but they separate their ego from their trading. They might have serious conviction behind their positions, but when the market proves them wrong, they don’t argue with it. They simply move on and accept it.
Two things I never argue with: the stock market and women. Both of them are smarter than me, and both are always right! (BR: Spoken like a married man)
4) Consistency: The best at anything are the best because they are consistent. Michael Jordan isn’t considered the best basketball player ever because he scored 30 points ONCE in a game. It’s because he averaged 30 points per game over his ENTIRE career.
Traders should not obsess with their day-to-day profit & loss. Rather, they should shoot for consistent positive months, quarters, and years with minimal draw downs. You do not want to be the “boom and bust” trader who does well in a strong market but gives it back during market corrections. These guys are a dime a dozen and typically get blown out of the market at key pivot points (Last cycle, I knew a few who became mortgage brokers — how is thatfor timing?)
5) Students of the market: Successful traders NEVER get complacent. They are always eager to learn, constantly looking to improve their skills.
One way to improve is through post analysis of your trades. It is important to look at your numbers and make sure your losses are smaller than your gains.
For technical traders, studying your entry points and looking at charts that worked (and didn’t work) is part of the constant learning experience of becoming a confident and consistently profitable trader.
~~~
Fahmy holds seminars for active traders who want to improve their returns.   Readers of the Big Picture who are interested will get a $500 discount on the full day event. Go to TradingBigWinners.com and enter the promotional code: “bigpicture500” for the New York (3/3) seminars. I will be discussing trader psychology and cognitive errors at this seminar.

Wednesday, March 2, 2011

Gold and Silver: Potential Price Target

-------------------------------------------------------------------------------------------------

The gold and silver markets rallied dramatically to the upside as concerns and worries over oil supplies, inflation, and general nervousness in the world markets pushed both metals into new high ground.

I have just completed a new short video where I share with you my upside target zones for gold. The video only takes a few minutes to watch and emphasizes how important technical analysis is in the gold market. Our weekly Trade Triangles have been long gold from $1,368 and it looks as though that position is going to work out well.

We also refer back to a video that I made on September 20th last year, which underscores the importance of cyclic work in the gold market and, how if these same cycles hold true, can predict with a fair degree of certainty when the next cyclic high is going to occur.

I reveal all of this in this new short video that I think you'll find both informative and educational. Take a look at the short video here:

http://www.ino.com/info/683/CD3866/&dp=0&l=0&campaignid=3

As always all our videos are free to watch and there are no registration requirements. If you'd like to share this video with your friends, please feel free to do so.

Wednesday, February 23, 2011

A short gold position could pay off with this scenario

http://www.ino.com/info/681/CD3866/&dp=0&l=0&campaignid=3
--------------------------------------------------------------------------

In this 4 minute video I explain exactly what I mean by a "short gold position." It does not mean I am bearish on gold, however the scenario I point out in this video could make money by being short gold and long another important market.

The video points out what the scenario is, and which market you should be long in, against a short gold position. This is an interesting twist and a video you shouldn't miss.

As always our videos are free to watch and there is no registration required.

If you would like to tweet or e-mail your friends and share this video please feel free to do so. All we ask in return is that you comment on our Trader's Blog about the video.

In this 4 minute video I explain exactly what I mean by a "short gold position." It does not mean I am bearish on gold, however the scenario I point out in this video could make money by being short gold and long another important market.

The video points out what the scenario is, and which market you should be long in, against a short gold position. This is an interesting twist and a video you shouldn't miss.

As always our videos are free to watch and there is no registration required.

If you would like to tweet or e-mail your friends and share this video please feel free to do so. All we ask in return is that you comment on our Trader's Blog about the video.

Tuesday, February 8, 2011

Gold

Why is gold not going higher with all the turmoil in Egypt?

Despite all the turmoil in Egypt and the Arab world, gold has stubbornly refused to rally. This probably causes great concern amongst the gold bugs and the folks who are bullish on gold.

As we have mentioned before many times on this blog, "perception is more powerful than fundamentals."

While the gold bugs argue that the market is being manipulated, I am more of a realist and respect what the market is actually doing. The big question on everyone's mind is: Why are food prices and other commodity markets soaring, while gold is dismally staying down in the $1,330 area?

MarketClub's Trade Triangles are all Red, meaning that the trend for gold is likely to remain negative or at best move in a sideways fashion.

http://www.ino.com/info/669/CD3866/&dp=0&l=0&campaignid=3

My best estimation at this point in time is that we are going to see more sideways action and probably some recovery from current levels. However, I would like to see some concrete evidence that the market has actually put in a low and that we will see a recovery in this yellow metal in the future.

One thing I can say, historically our monthly RED Trade Triangles have not been successful in gold. You would have been more successful fading the RED monthly Trade Triangle signal and going long gold.

Before getting, "gung ho" on this approach, you will be better off waiting for a green weekly trade triangle to kick in which would indicate that the market has probably made a low.

That is the main reason why, we recommend using the weekly Trade Triangles for trend, and daily Trade Triangle's for timing.

In this short video, I explained what I mean and show you concrete examples of how you can use this strategy to make money.

As always our videos are free to watch and there is no registration requirements. Our only request is that you tell your friends, Tweet and Facebook about this blog posting. We would also enjoy hearing from you, so please feel free to comment on this blog about this video.

Enjoy,
All the best,
Adam Hewison

Wednesday, January 26, 2011

Gold: What comes up, must come down

The question many investors are asking themselves today is, just what happened to the price of gold?

Did the world change? Did the problems in Europe go away? Did all the states manage to find funding to cover their deficits?

No, none of that happened, but gold still dropped $100.

It's all about market perception and timing, two things we've talked about many times before on the Trader's Blog. I don't know about you, but I remember when gold was over $1,400 an ounce and all I could see on TV where ads from gold companies extolling the virtues of buying gold as it is real money. Since the fall, I expect we'll see fewer of these advertisements on TV and in print.

So what did happen to gold?

Well, for starters there were some key technical levels broken. If you're a gold trader, but not a technical trader, you really need to learn how to read charts and see what other traders are doing.

Free technical trading course from MarketClub here: http://club.ino.com/join/lessons/

Secondly, there did not appear to be any other news to drive this market higher. When that happens, markets tend to fall under their own weight, and as many retail investors purchased gold, there was nobody on the other side of the market to support gold.

So the question is, is the move over in gold? That's a tricky one. I want to show you in today's video exactly how we're looking at this very emotional market. Every time we have created a video indicating that there would be some pullback in gold, we were bombarded by the gold bugs saying that we're crazy. When you see a market pullback as much as gold has, you have to have some respect for the market itself.

If we look at the price of gold today at approximately $1,330, it pretty much equates to what happened in the last 30 years when gold was trading at a high of $850 an ounce. If you factor in inflation over the last 30 years, gold is probably lower now than it was 30 years ago. So how good an investment is gold? I think gold is more of a barometer of fear than anything else. Clearly there are other investments in the marketplace that have better returns.

Let's get back to gold and what we think will happen. In this short video we analyze the market using our "Trade Triangles," the Williams%R, and the MACD indicator.

As always our videos are free to watch and there are no registration requirements. If you like what you see please comment on our blog and feel free to Tweet or e-mail your friends. I think there's an important takeaway message in this video - what goes up, must come down.

Enjoy the video.

http://www.ino.com/info/668/CD3866/&dp=0&l=0&campaignid=3

Adam Hewison

Monday, December 6, 2010

my most valuable setup

For you swing trade traders out there,

The setup is fresh in my mind because just last week my subscribers and I used the setup to take a 28-point profit in the S&P 500.

I call it the ‘box trade.’

As with many things in trading, the more simple, the better. I live by that principle both in my personal life and in my trading career as well. And I think you’ll be hard pressed to find a more simple trading setup than my ‘box trade.’ So whether you’re new to trading, or you’ve been trading for years, this setup is right for you.

To fully understand the methodology behind the setup, you first need to understand how markets work. And what I’m about to tell you is true of all markets.

Markets trend and they consolidate, they expand and contract. It’s just the nature off all markets, and it has been for as long as man began trading goods.

When a market is trending (or expanding) it is making new highs and new lows. It’s at times like this volatility is a at a premium, and traders stand to make a good deal of money on the bigger moves. However, trending markets only occur a small percentage of the time. The rest of the time, markets consolidate. And it’s during this consolidation time as traders we must be prepared to catch the next big move.

In the S&P 500, these big moves normally occur after it’s been consolidating in a range for at least two weeks – this forms the box. See below:

That movement back and forth forms the box, and we need to pay very close attention to where the market trades, and where it closes.

For this setup to be valid, the S&P 500 much touch both the top, and the bottom of the box at least twice while consolidating in the range. As you can see here, the range of this box was approximately 30 points from 1170 – 1200. And the price action ‘kissed’ both the top and the bottom of the box on more than one occasion. It was a text book box trade:

Now, after this occurs, it’s our job to watch for the break.

Usually within a few weeks the break will occur – the market will stop consolidating, and begin trending. However, there really isn’t a way to know which way the market will break, so we wait.

The direction of the break really doesn’t matter, because we can take either side and profit. So we wait for the break to occur and then take the trade.

Here’s when you take a position: after the S&P closes either above the top of the box, or below the bottom of the box, the trade is on. If we break to the upside, we go long. If we break to the downside, get short, and that’s it.

In this case the S&P 500 broke to the upside:

Once the break occurs, you can expect the market to move a distance equal to the height of the box – in this case 30-points (1200-1170 – 30 points).

Once you’re in the trade, the only other thing you need to watch is your stop loss. And I close out the trade if the market ever closes back inside the box – because that would invalidate the break.

And there you have it my ‘box trade.’ This trade works 75% of the time, and occurs about 3-4 times per year.

As I mentioned earlier I use the setup to trade the S&P 500 emini. However, the beauty of the setup is that you can use it to trade any instrument that tracks the movement of the S&P 500 – So if don’t trade futures, you can trade ETF’s like SPY, SSO, and the like… Just remember to watch the action of the emini futures contract for the signal to take the trade.

So the next time you feel the market is range bound, pull up a daily chart, and see if the emini is forming a box. If it is, there may be a profitable trade right around the corner…

Good Trading,
Brian Heyliger

Tuesday, November 30, 2010

New Video - It's more important to the market than Ireland, Greece, Portugal, and Spain combined

It's more important to the market than Ireland, Greece, Portugal, and Spain combined

The trials and tribulations of these four countries (that have run up huge deficits) have been well known for quite some time. What is more important in my opinion is not the size of the debt, which is staggering, but rather what is going on with market perception.

Market perception trumps everything else out there. Market perception trumps market fundamentals every time. Market perception is the one card that the government cannot control. It is the card that can potentially give the individual trader an edge.

So what is market perception? Well, have you ever noticed that when some big world event happens, or a new "hot" IPO hits the markets, traders expect that market to go in the talked about direction and typically it does. What doesn't get talked about is how the market then corrects itself and the technicals really come into play.

The only real way to avoid the trap is through the use of technical analysis, or in the case of MarketClub, our "Trade Triangle" technology. This technology doesn't read the newspapers, doesn't watch cable news, and is independent of everything else except the market itself.

What is the most important thing to most investors? I would have to say it is the bottom line. If you're not making money in the market, then you're doing something wrong. Maybe you're paying more attention to the talking heads on cable, or to the nightly news, but you're not really paying attention to market perception.

I was lucky enough when I began my career to learn about technical analysis very early on. I said to myself, when it can be this easy there must be something more that I'm missing. It was then that I made the mistake of looking at all these other so-called tools like fundamentals, earnings reports, etc. You name it, I looked at it.

One day I finally got smart and realized that I had already found the "true gold" in trading by using technical analysis.

I was just watching some talking head author on TV and they were saying that technical analysis is so 1920's and old technology. Of course, the person who was saying that was looking to sell copies of their book.

I said to myself, boy oh boy, not to look at technical analysis, which is like the DNA of the market, is a huge mistake. I can see people going out and buying this author's book and being led down the wrong path. I will not name the book as readers of this gobbledygook are going to spin their wheels only to find that it really doesn't work.

Let's keep things simple. That is the secret to successful trading.

http://www.ino.com/info/649/CD3866/&dp=0&l=0&campaignid=3

At MarketClub we tend to look at the market in a very simple fashion. Let me explain; the market can only do three things: it can go up, it can go down, and it can go sideways. In life there are very few things that you can simplify as easily as that.

So using MarketClub's "Trade Triangles" you are able to determine when the market is going up, in which case you want to be long, and when the market's going down, in which case we want to be short or out of the market.

Now of course we do filter the "Trade Triangles" of MarketClub to help avoid trading losses. With any kind of trading or investing program the risk of loss is always there. The key to success is how you manage those losses. Are the losses small enough as to not bite into your capital in a major way?

Again, when you're looking at market fundamentals or other ways to trade, they really don't tell you when to get out. Obvious examples of this would be the Enron scandal or the recent GM debacle that took unwary investors to the poor house.

But it's hard to fake a market saying everything is great, when the market is heading south. So what is an investor to think? I believe you have to trust your eyes and the direction of the market. After all, that's what makes up your bottom line.

In today's video we're going to be looking at one or two markets and how the "Trade Triangles" are positioned right now. We are not predicting what's going to happen in the future. We are simply going to look at the purity of the "Trade Triangles" and how they can help investors with the most important market element of all, market perception.

Enjoy the video.

All the best,
Adam Hewison

Where is Gold headed and how can you prepare?

So the question becomes, is the gold market pausing to move higher, and of course the Bulls would argue this, or is it forming the head and shoulders top that many technicians are looking for? Of course, this would be a bearish sign for gold if this technical formation is completed.

I've just finished a short video that shows you what we're looking at right now in gold and how I think it is going to be resolved. The video is a little over 2 minutes. It's quick and to the point while supplying you with what you need to take your place in or out of this market.

Watch the video here: http://www.ino.com/info/654/CD3866/&dp=0&l=0&campaignid=3

You may also wish to attend our gold webinar which we are holding on the 2nd of December at 4 PM EST. The webinar is free of charge, but you need to register in order to attend. This is no hype, but we have limited space and it will be on a first-come first served basis. The important thing is that you register as soon as possible.

Here is the link to register for the webinar: http://www.ino.com/info/651/CD3866/&dp=0&l=0&campaignid=21

While you do need to register to attend our gold webinar, in order to watch today's short video no registration is required nor is there any charge.

We hope to see you at this week's Gold webinar so don't forget to register.

All the best and enjoy today's video.

Adam Hewison
President of INO.com
Co-founder of MarketClub

Wednesday, October 6, 2010

GOLD again

A little while ago I made a video that projected some amazing levels
for gold. Given the strong upward trend in gold and the price action on
Tuesday the 5th of October, it is worthwhile looking at this video again:

http://www.ino.com/info/635/CD3866/&dp=0&l=0&campaignid=3

This short video, will certainly give you some interesting price targets
for gold that are based on sound trading principles. I hope you enjoy the video,
and as always we would love to have your feedback on our blog.

Friday, August 20, 2010

The bear is back!!

New S&P 500

The early market action on Monday, August 16th, triggered a key weekly "Trade Triangle" to the downside. Our weekly "Trade Triangle" turned red, indicating that all trends are negative and now pointing lower.

In this new 90 second video I show you some of the scenarios we can see playing out for the S&P 500. I think you'll find this new video informative and educational. You will also come to understand the power of our "Trade Triangle" technology.

Please feel free to comment with your thoughts on this market.

As always our videos are free to watch and there is no registration needed.

All the best,
Adam Hewison
President of INO.com
Co-founder of MarketClub


Friday, June 25, 2010

Market Divergences

What do you know about market divergences?


http://www.ino.com/info/574/CD3866/&dp=0&l=0&campaignid=3

---------------------------------------------------------------------------------------

In the market there are two types of market divergences that can occur:
a bullish divergence and a bearish divergence. Both of these divergences
are important and you need to know how they work and how you can benefit
from this knowledge.

In this short educational trading video, I will show you the tools I use
to spot market divergences. We will be using the Relative Strength Indicator
(RSI) and the Moving Average Convergence Divergence indicator (MACD) which was
developed by a friend and mine, Gerald Appel.

As always our videos are free to watch and there are no registration requirements.
If you would like to comment on this or any of our other videos, please do :-)

Wednesday, June 16, 2010

A quick update on the state of the S&P 500

The sharp rally we saw on Friday followed through on Monday, but appears to have run out of steam. In this new short video, I show you what you should be looking at in this market and how I think it should be played.

The video is short, less than two minutes, but you'll get a lot of good information that will help you trade these choppy, choppy markets.

http://www.ino.com/info/567/CD3866/&dp=0&l=0&campaignid=3


The Talk Of The Day Is Crude Oil

Whether it is the spill in the Gulf, which continues unabated, or talk on Capitol Hill, the subject is crude oil.

Today we received a signal by way of our weekly "Trade Triangle" to get long crude oil. In this new brief video, we show

you the exact levels to keep your eye on and also where a logical stop would go for this position. We have had a lot of

questions on Fibonacci retracements lately and this video goes into detail about that phenomenon and how you can best use it.

http://www.ino.com/info/568/CD3866/&dp=0&l=0&campaignid=3


Friday, June 11, 2010

Fast Money Trading Team

You have the opportunity to become a successful Fast Money Trader by following Bruce Bill Brents as the head trader and teacher live daily at FastMoneyTradingTeam.com FREE for 30 days then about $7.00 per day or one commission. Thanks to the createror of the FastMoneyTrading Team Anthony Geraldi who convinced Bruce Bill Brents to become the trader and teacher. Without Mr. Geraldi you would have never experienced Brents' live and amazing accuracy in day trading only the first 60 minutes each day. While other traders hedge their bets and say that they would have bot or sold after the fact Brents tells you before the Mkts open and then what price and exactly when to get in (live) daily. His style of trading is not ideal for the traders who like to watch the market all day and think what if. He takes the same dollar amount each trade whether you can follow him or not is up to you. Before you make a decision whether you follow and adopter his style ask yourself how successful are you really then look at his track record. Good Luck

One year later, reality sets in for the S&P500

It's been just a little over a year since we had our first major buy signal for the S&P 500 at 888.70 on 5/4/09. Since that time, the S&P 500 has climbed approximately 61.8% from the lows that were seen in early March of '09 and the highs that were seen in October of '07.

We take our "Trade Triangle" technology very seriously and this signal today (5/25) at 1044.50 is our first major sell signal since 7/1/08 at 1,272.00 and should not be ignored.

FREE VIDEO ---> http://www.ino.com/info/558/CD3866/&dp=0&l=0&campaignid=3

There are a whole host of problems that are coming due around the world that will have negative consequences for the equity markets. The problems in Greece and Europe are well known and are likely to continue for the balance of the year. This is going to have a negative impact on markets in general.

In my new short video I show you exactly what I think is going to happen to the S&P 500 market and just how you can protect yourself if we are correct. As always our "Trade Triangles" will dictate all market action. At the present time all of our "Trade Triangles" are negative and pointing to the downside. This indicates that a very strong trend is in place and it likely to continue.

Many traders, especially younger traders, are unaware of how bear markets work. Bear markets tend to be demoralizing as they do not have any strong and sustained rallies. They tend to erode as more and more traders become unnerved and throw in the towel.

I invite you to take a look at this new video with no registration and no charge.

All the best,
Adam Hewison
President, INO.com


Wednesday, May 26, 2010

One year later, reality sets in for the S&P500

It's been just a little over a year since we had our first major buy signal for the S&P 500 at 888.70 on 5/4/09. Since that time, the S&P 500 has climbed approximately 61.8% from the lows that were seen in early March of '09 and the highs that were seen in October of '07.

We take our "Trade Triangle" technology very seriously and this signal today (5/25) at 1044.50 is our first major sell signal since 7/1/08 at 1,272.00 and should not be ignored.

http://www.ino.com/info/558/CD3866/&dp=0&l=0&campaignid=3

There are a whole host of problems that are coming due around the world that will have negative consequences for the equity markets. The problems in Greece and Europe are well known and are likely to continue for the balance of the year. This is going to have a negative impact on markets in general.

In my new short video I show you exactly what I think is going to happen to the S&P 500 market and just how you can protect yourself if we are correct. As always our "Trade Triangles" will dictate all market action. At the present time all of our "Trade Triangles" are negative and pointing to the downside. This indicates that a very strong trend is in place and it likely to continue.

http://www.ino.com/info/558/CD3866/&dp=0&l=0&campaignid=3

Many traders, especially younger traders, are unaware of how bear markets work. Bear markets tend to be demoralizing as they do not have any strong and sustained rallies. They tend to erode as more and more traders become unnerved and throw in the towel.

Tuesday, May 18, 2010

Do you know where to placeyour stops in Gold?

I thought I would get you attention did you know that Gold is the most popular market that we cover, and whenever we write about it, or produce a video featuring this precious metal, unsurprisingly, it also tends to generate the most passion of any market that we cover. With gold making new highs recently, I thought it would be timely to put together a video showing you where we are placing our short-term stops. The video is about 90 seconds long and shows you in a very visual way, what we're looking at in this market.

http://www.ino.com/info/556/CD3866/&dp=0&l=0&campaignid=3

The video is available for viewing now and there is no charge or registration requirement.


The S&P has Topped out or has it?

http://www.ino.com/info/554/CD3866/&dp=0&l=0&campaignid=3

There are a lot of very nervous people in the market. I think this nervousness has been obvious in much of the market action, and it is not likely to go away anytime soon.

One of the great things about our "Trade Triangle" technology is that it both takes emotion out of the market and gives you a game plan to be successful. In this short video you will see exactly what I mean.

http://www.ino.com/info/554/CD3866/&dp=0&l=0&campaignid=3

We're always interested in your views and comments and encourage you to visit our blog to let us know what you think.

Thursday, May 13, 2010

And You Thought You Knew GOLD

Most market analysts will agree that supply and demand economics are a major influence on the current price of a commodity. It is however market sentiment that greatly determines the perceived future price. If one can understand, and quantify market psychology or market sentiment, one can more effectively forecast future prices. This has been the underlining assumption of Elliot Wave and Fibonacci Retracement theory.

To the market technician Elliot wave and Fibonacci retracement theories go together like peas and carrots. Elliot Wave incorporates many aspects of the Fibonacci sequence and retracement theory. It uses different retracement levels as benchmarks that certain waves should go to. Even though when R.N. Elliot created his theory he did not know of Fibonacci theory and only made this correlation later on in his studies, they are now considered to go hand in hand with each other.

Might I suggest a third ingredient to the mix, Japanese Candlestick pattern theory? I have found that adding this technique in combination with both wave and retracement theories can deliver greater market insight.

These techniques are all based upon the assumption that a market’s behavior is based upon natural laws of nature and laws of market psychology. They all believe that these natural cycles can be identified and quantified to use in market forecasting. All three techniques believe that the ways markets behave are predicable; because there is a mass psychology that guides and defines the way we as traders think. All three techniques although different, have identified a specific and mathematically definable set of rules and guidelines.

Elliot wave, Fibonacci retracement and Japanese candlesticks are roadmaps or descriptions of how markets might perform. They are all able to define market sentiment or market psychology in mathematical terms. It is my assumption that by combining these three techniques together the synergistic effect is a more reliable and a much more effective process for price forecasting.

As the executive producer for the “Forex Gold Forecast” tm, a daily video newsletter, my focus has been on the price of gold. As of this writing gold is trading at a record price, as the prior historical price of 1221 was surpassed and is currently trading at 1230. The price of gold has moved in a predictable manner, if you know the right roadmaps to follow. By applying the Elliot wave count, one is given a tremendous amount of information and insight.

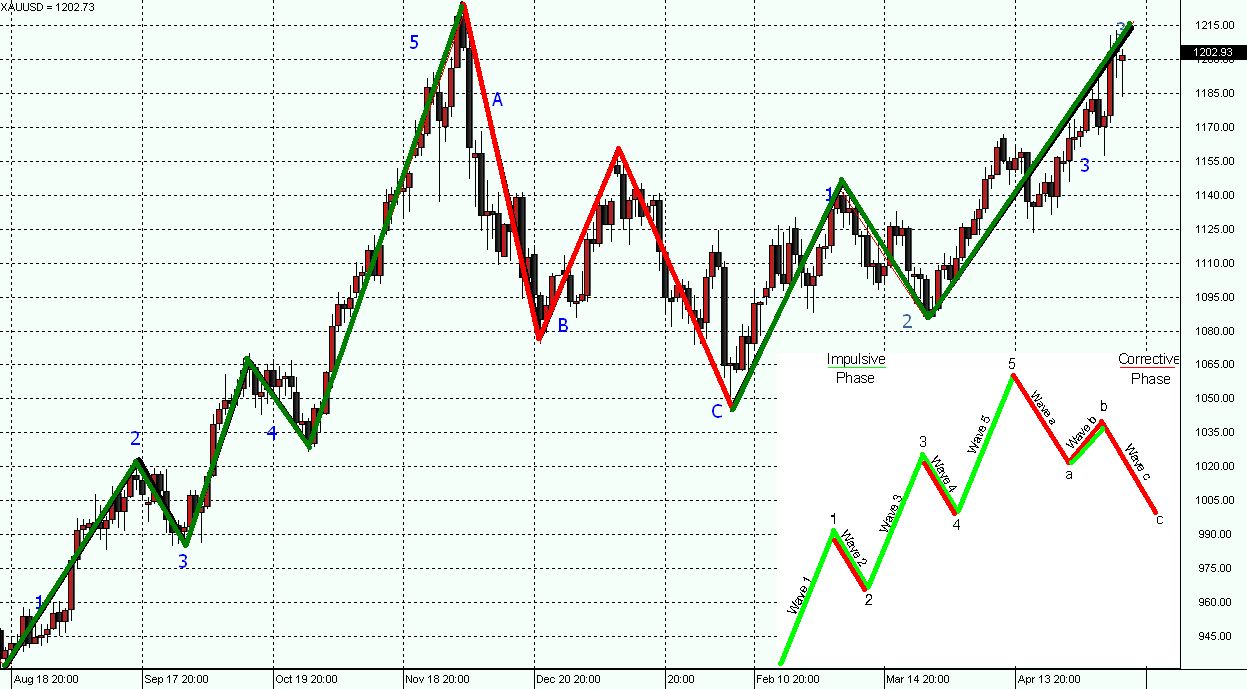
According to Elliot wave theory, a market trend follows a cycle. That cycle is made up of eight waves. This eight wave sequence will repeat until the trend is exhausted. This trend structure is composed of eight waves, divided into 2 phases; the motive phase and the corrective phase. The motive phase is composed of 5 waves (waves 1 through 5). Waves 1, 3 and 5 will move in the prominent direction of the trend. These 3 waves are called the motive waves. They will be separated by two retracement or corrective waves (waves 2 and 4), where the price action will move against the current trend. The corrective phase is composed of three waves (A, B and C), they will move opposite the primary trend. Waves A and C will be corrective waves, while the B wave will move in the direction of the primary trend.

Figure 1 Daily US/UAX (Forex gold) candlestick chart with Elliot Wave count

Figure 1 is a daily candlestick chart of Forex gold (US/UAX) in which the Elliot wave count has been added. The motive phase drives gold to a new historical high of 1221 in December of 2009. The corrective phase in Forex gold lasted from December 2009 to February 2010. With this top in place we were able to calculate our Fibonacci retracement levels. We used the low created just before gold broke 1000 which was at 980 dollars per ounce, and the high at 1221dollars. During the corrective phase the market will give back a percentage of its gains. It will not be until the completion of the full wave count at the C wave that gold will find a bottom, and begin the wave count all over again. By the completion of this corrective phase, gold had given up almost 78 % of its gains closing at just 1040 dollars per ounce.

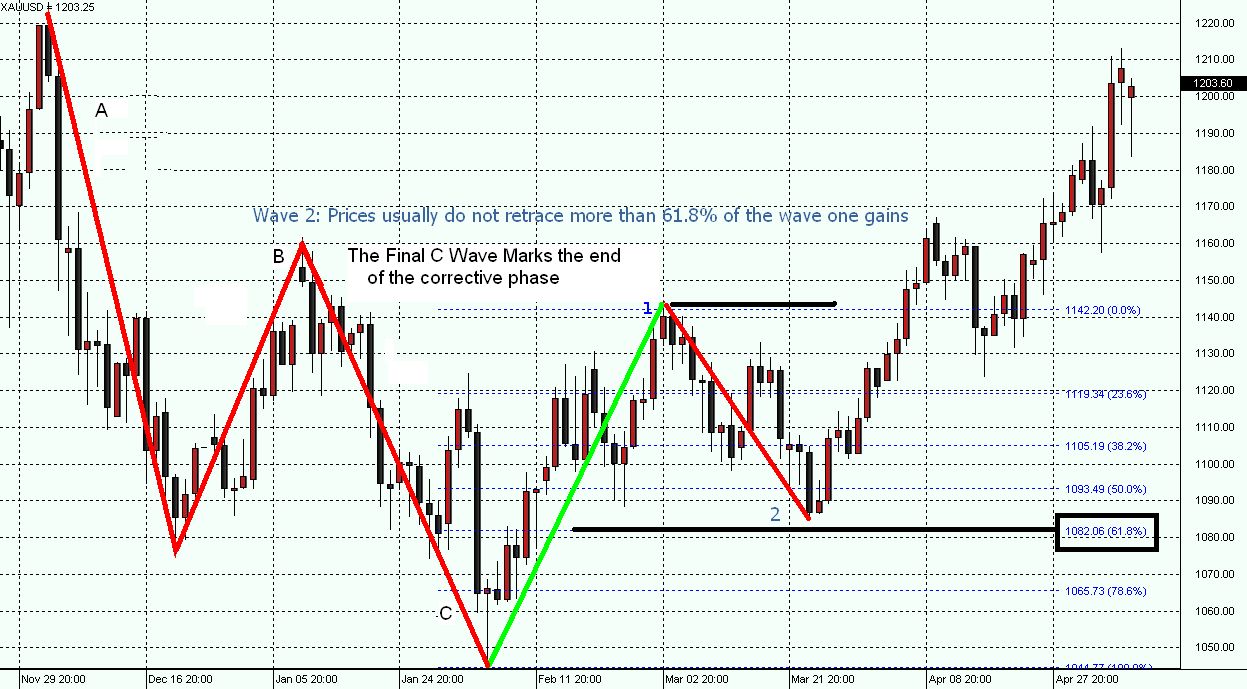
Figure 2 Daily US/UAX (Forex gold) candlestick chart from corrective phase to current motive phase

After the completion of the eight waves, the cycle is completed and the count begins again. Once again the gold market enters the motive phase. This is the phase we are currently in. The first Wave (1) occurred on February 2, 2010, as seen in figure 2. From a low of 1040 per ounce, gold climbed 100 dollars higher to over 1140. Gold prices moved from the 78% retracement level to above the 38 % retracement level on this single wave. This signaled the first corrective wave (2). There are specific rules for the wave count. Corrective wave 2 should not retrace more than 61.8 % percent of the gains achieved in wave 1. Wave 2 which took just under three weeks to complete did in fact trade right to that Fibonacci retracement level.

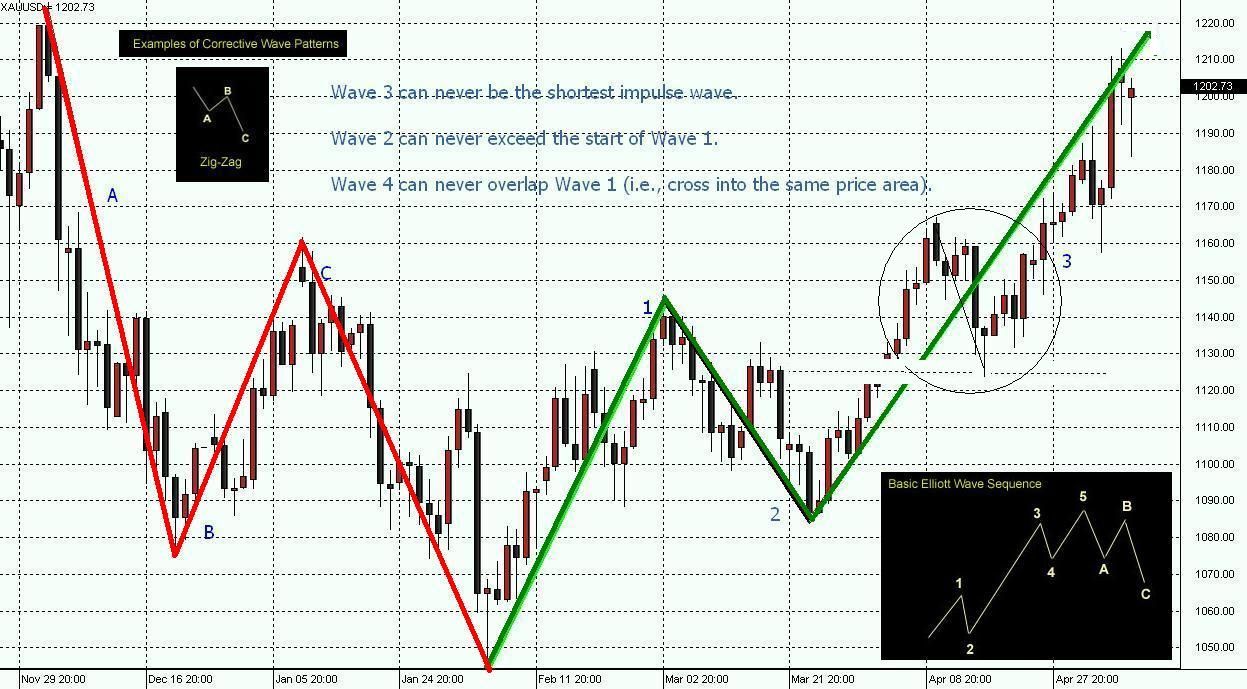
Figure 3 Daily US/UAX (Forex gold) candlestick chart with Elliot Wave Rules

To the untrained eye, some might consider the wave count to be subjective, with room for interpretation. Because of the complexities in which markets behave, there are many variations to basic wave pattern. However all wave patterns must follow 3 major rules that R.N Elliot indentified. These three rules have no flexibility, and for one to achieve a correct wave count all 3 rules must be followed. Figure 3 illustrates the basic example of the wave count with all three rules in place. Because rule three states that wave 4 can never overlap wave 1, we have a clear indication that the current wave 3 has not ended.

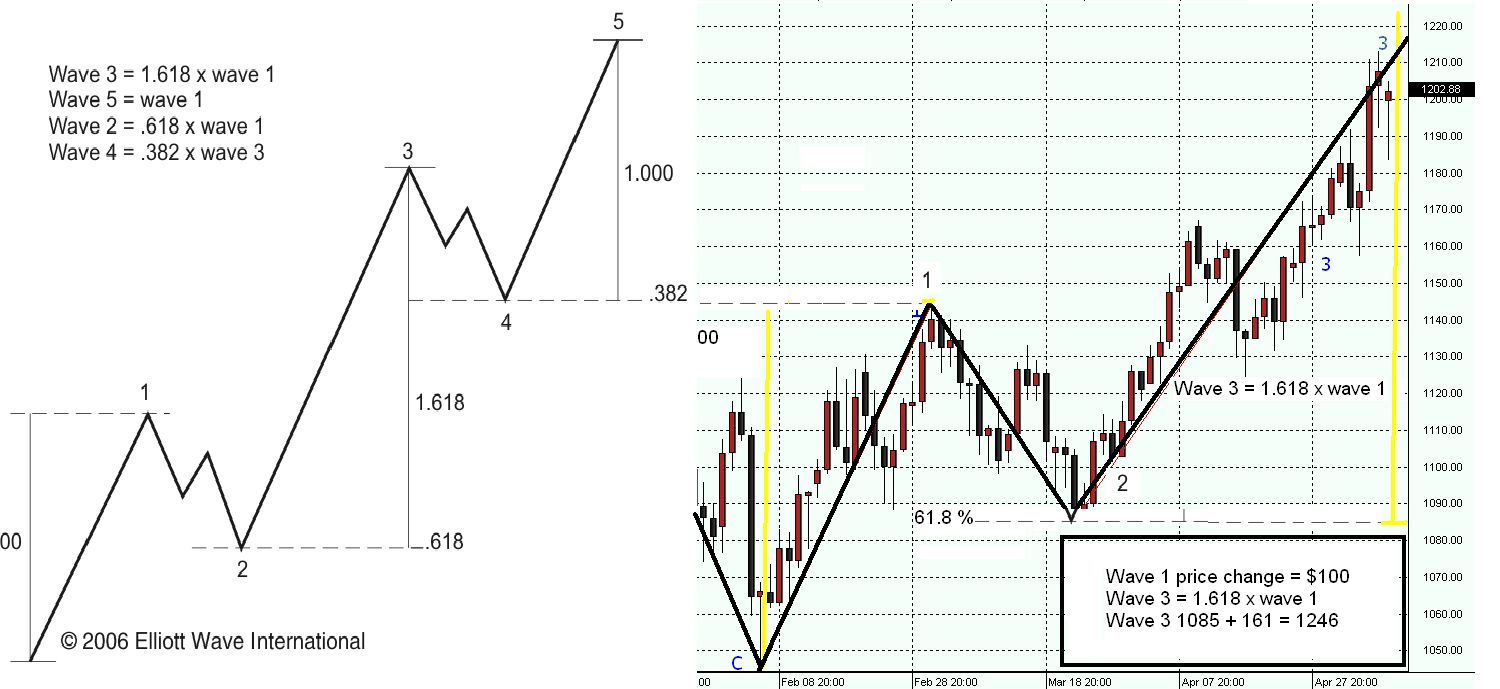
Figure 4 Daily US/UAX (Forex gold) candlestick chart with Fibonacci wave rules

Figure 4 is a daily chart of Forex gold starting at wave 1 after the completion of the 8 count. This chart contains the Fibonacci rules needed for a correct wave count. According to this count we are currently in wave 3. If this wave count holds true, we could see the full wave not completed until it reaches 1.618 times the size of wave 1. This could take the market as high as 1246. We should experience a corrective wave (wave 4) after the completion of wave 3; this correction should retrace roughly 38 % of the gains in wave 3. This will be followed by one more motive wave (5) to complete the motive phase. Wave 5 should take gold to a new record high price, moving a length equal to wave 1.

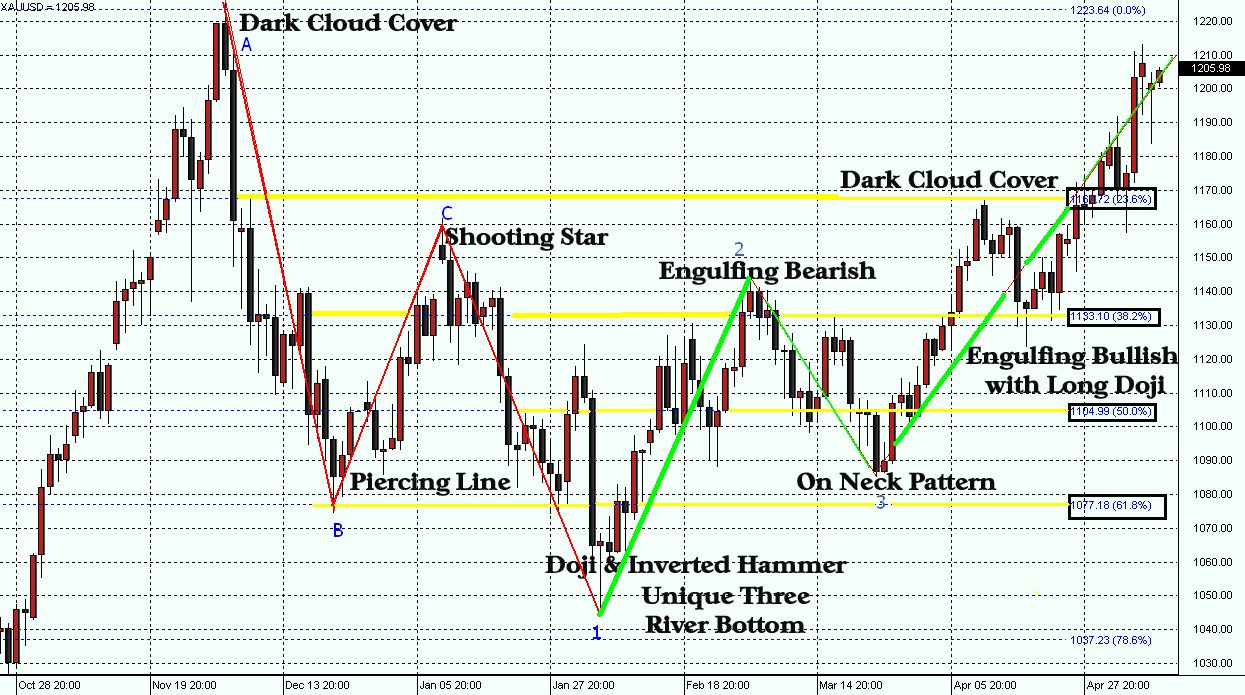
Figure 5 Daily US/UAX (Forex gold) candlestick chart with Elliot Wave, Fibonacci and Japanese Candlestick Patterns.

Figure 5 examines all three components of this technical triad: Elliot wave, Fibonacci retracement and Candlestick patterns. If we look to see the points where all three indicators are in confluence, we can effectively create a triple filtering system.

In figure 5 the first corrective phase’s wave (A) trades to a low of 1077, the 61 % Fibonacci retracement point. A piercing line pattern forms and signals a bullish reversal... The B wave trades higher finding resistance just below the 23 % Fibonacci resistance level. A “Shooting Star” candle marks the top. This marks the end of wave B. The C wave, which is the last of the corrective phase breaks below the 61 % retracement point and just before it reaches 78 % multiple candlesticks and a rare candle pattern form. Two reversal candles the Doji and inverted hammer are part of a pattern called a unique three river bottom. This signals the end of the corrective phase, and a new wave count begins at again. An Engulfing Bearish signals the end of wave 1, just as the on neck pattern signals a bullish reversal and the end of wave 2.

It is my contention that Japanese candlesticks have an uncanny ability to reveal and identify key reversal points quickly; however filtering these signals with other market information is a critical component for success. Where a pattern is found within the trend determines the strength or weakness of that signal. By looking at all three methods at once, one is given a very comprehensive market analysis. By combining these three methods one can produce much greater insight then any of these techniques by themselves. They completely complement each other, and naturally form a more synergistic approach to market forecasting.

Gary S. Wagner

-----------------------------------------------------------------------------------------------------------------------------------

Bio:
Gary S. Wagner has been a technical market analyst for twenty five years. He is the Co-author of “Trading Applications of Japanese Candlestick Charting”. A frequent writer for Technical Analysis of Stocks & Commodities magazine, he also Co-developed software applications for market forecasting. “

Wednesday, May 5, 2010

Two Great calls on the MKT before it happened

We are not wright 100% or 90, or 80% but you be the judge who and what do you want to follow>

Pulled The Trigger on the Dow:
http://www.ino.com/info/552/CD3866/&dp=0&l=0&campaignid=3

The S&P went south and we cashed in our chips:
http://www.ino.com/info/551/CD3866/&dp=0&l=0&campaignid=3